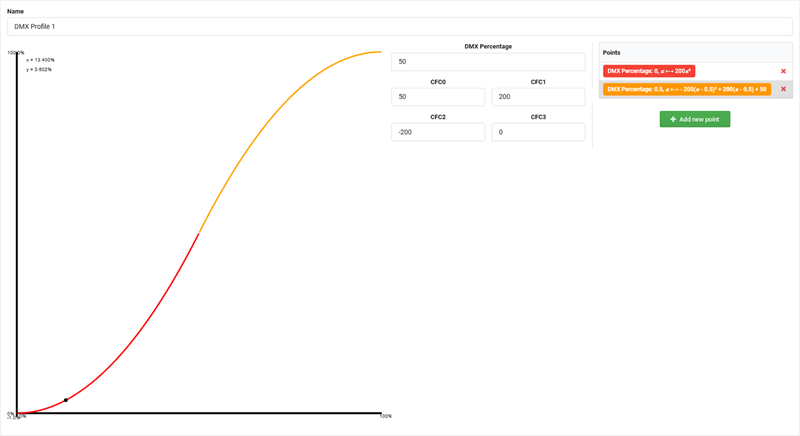
The PhysicalDescrptions page allows defining Emitters, Filters and DMX profiles that can later be linked to a channel function of a DMX channel.
In the column on the left, all Emitters, Filters and DMX profiles are listed. When selecting an item, all of its properties can be viewed and edited in the big panel on the right.
To create a new PhysicalDescription item, go to one of the tabs in the left panel (Emitter/Filter/DMX Profile) and click on + Add Emitter, + Add Filter or + Add DMX Profile.
To duplicate an item, select it, open the context menu (≡) and choose Duplicate Selection.
To delete an item, click the red X symbol.
Select an emitter to display its properties.
The name of an emitter needs to be unique in order to identify it later. To set the Color of an emitter, either enter the values in the format CIE x, y, Y or click the edit symbol (📝) to open a color picker and choose a color.
Select a filter to display its properties.
The name of a filter needs to be unique in order to identify it later. To set the Color of a filter, either enter the values in the format CIE x, y, Y or click the edit symbol (📝) to open a color picker and choose a color.
Emitters and Filters allow entering measurements about the light output and spectral distribution at a given DMX percentage. This enables control and visualization applications to precisely calculate the color mixing characteristics of a device.
By default, the measurements describe the light output at a DMX value of 100% for the given emitter or filter. To add measurements for a different DMX value, click the + icon in the tab bar of the spectral distribution section.
Spectral distribution data can be imported from a CSV file. Click the + Import from CSV button and select a CSV file with measurements on the hard drive. Each measurement at a given DMX percentage can hold individual spectral distribution data. The CSV file must contain two columns separated by semicolon (;):
A DMX profile defines the relation between a DMX input value and a physical output value. The name of a DMX profile needs to be unique in order to identify it later.
A DMX profile contains one or multiple points. Points contain a mathematical function to describe the relation between DMX input and physical output. To add a new point, click + Add new point. Each point has the following properties:
The following example shows how to create an S-curve DMX profile:
An application that is using the data calculates the output the following way:
